Find Abnormal Bandwidth Usage, from Link to Process
Investigate unusual network usage with PRTG, Zabbix, NetFlow, FortiView, Wireshark and Resource Monitor, plus complementary checks and a practical scenario.
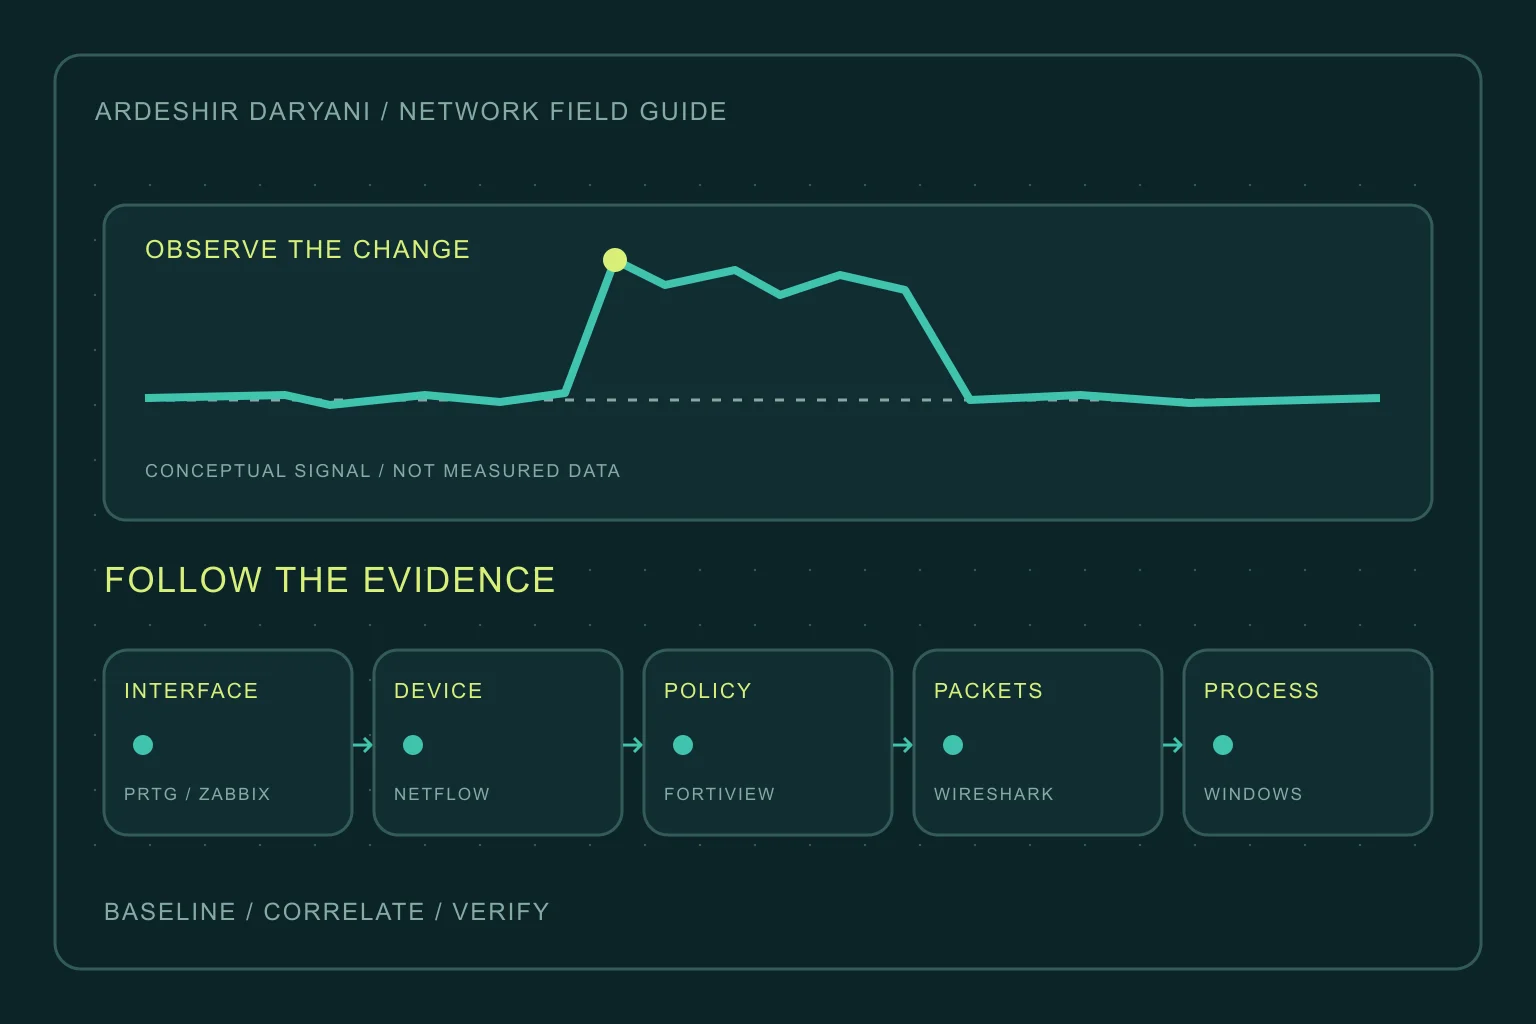
The network is slow, and the first proposal is a bigger connection. Yet the cause might be an unscheduled backup, cloud synchronization, an internal loop or repeated transmission. Before buying capacity, establish where the pressure begins, where it goes and which activity creates it.
This article follows an investigation from the network overview down to an individual process. Operational steps and decision criteria are our editorial recommendations; tool capabilities and limitations are checked against primary documentation. None of the examples claims to describe a test performed on the reader’s network.
First define what abnormal means
High traffic is not automatically abnormal. An expected backup peak differs from continuous sending during an otherwise quiet period. Record the start, duration, direction, affected area and user impact. Compare similar hours and days, rather than only the quiet minutes immediately before the incident.
Distinguish transfer rate from transferred volume. Mbps is a rate; GB is a volume. In decimal units, 1 MB/s equals 8 Mbps. Effective service capacity can also be lower than the port’s negotiated speed. On a full-duplex link, compare each direction with its own capacity; adding inbound and outbound traffic does not establish saturation in either direction.
Choose a tool for the question
| Question | Primary tool | Evidence to retain |
|---|---|---|
| Which link, and when? | PRTG / Zabbix | Rate history, errors and drops |
| Which device talks to where? | NetFlow / IPFIX | Source, destination, direction and volume |
| Which policy or application? | FortiView | Traffic that traversed the firewall |
| What happens during transfer? | Wireshark | Conversations, rates and retransmission clues |
| Which Windows process? | Resource Monitor | PID and send/receive rates |
1. Monitor interfaces with PRTG or Zabbix
Start with WAN, branch links, uplinks and interfaces relevant to the affected service. Inbound and outbound are relative to that interface. PRTG’s SNMP Traffic sensor is a starting point; in Zabbix, use a suitable device template and inspect the item’s output units.
A raw cumulative octet counter must be converted to a rate using its change over time. In Zabbix, this involves Change per second and the appropriate unit conversion. Do not apply the conversion again to an item whose template already produces bit/s. For a raw counter, the relationship is:
bit/s = (counter_now - counter_previous) * 8 / elapsed_seconds
Use 64-bit counters where supported. Long polling intervals can conceal a short burst within an average; extremely short intervals also have monitoring costs. We recommend retaining each direction alongside errors, discards and packet rate. A universal threshold is no replacement for that link’s own baseline.
PRTG / SNMP · Zabbix / SNMP · Zabbix / Preprocessing
2. Find busy devices and destinations with NetFlow
An interface chart identifies a busy location, but usually not its consumer. Where the device supports it, export NetFlow or IPFIX from a relevant observation point to a compatible collector. Within the incident window, rank sources and destinations by bytes, then inspect direction. Session or packet counts alone do not measure transferred volume.
Record the exporter, observed interface, pre- or post-NAT location, sampling and collector timing. On sampled deployments, collector sampling settings must match the exporter, and results need to be interpreted as estimates. Seeing a flow at several locations does not mean the data was created several times; blindly adding every observation can double-count traffic.
Our practical recommendation is to map leading consumers to device owners, DHCP/IPAM records and service roles. A public NAT address or proxy can represent several users. Flow records generally do not provide decrypted request content; attributing usage to a particular business activity also needs application or endpoint evidence.
Cisco / NetFlow · IPFIX · PRTG / Sampling
3. Inspect traffic crossing FortiGate with FortiView
In FortiView, first select the relevant time range, device or VDOM and traffic path. Follow Sources, Destinations, Applications and Policies where supported by the installed version and features. Sorting by bytes answers a volume question; sorting by bandwidth answers a rate question.
Before interpreting an empty chart, check logging coverage and the data source. Historical views depend on the logs actually retained and their storage location; missing data does not prove missing traffic. Traffic that never crossed this firewall is outside its view. Interpret an application label in light of the visibility available to the tool.
An application name or destination country is not, by itself, a reason to block. We recommend following the heavy source through policy, destination and service ownership, then evaluating the impact of a restriction on necessary work. Menus differ across FortiOS versions; this section is not an instruction to change a live firewall’s configuration.
FortiView / Monitors · FortiView / Logging · FortiOS / Log settings
4. Analyze transfer behavior with Wireshark
Once device and path are known but the cause remains unclear, take a short, scoped capture. The observation point must actually see the traffic. On switched Ethernet, enabling promiscuous mode on an ordinary workstation does not reveal every other host’s unicast traffic. Use an appropriate capture location, authorized SPAN or TAP. This capture filter uses a documentation address:
host 192.0.2.25
Replace the example address with an authorized endpoint. In Statistics, review Conversations by bytes and direction, and compare rates over the same window using I/O Graphs. Bits over a 1-second interval helps interpret rate. The following lines are separate display filters, not the capture filter above:
ip.addr == 192.0.2.25
tcp.analysis.retransmission
Captured bytes are not automatically useful application data or WAN-counter bytes. Capture loss, duplicated SPAN traffic and observation location can distort interpretation; a retransmission flag alone does not prove a path fault. Flow sizes and patterns generally do not require decrypting TLS content. Keep captures scoped, time-bounded and access-controlled.
Wireshark / Capture · Conversations · I/O Graphs · Display filters · TCP analysis · Switched Ethernet
5. Find the Windows process with Resource Monitor
When the source is a Windows host, open Resource Monitor and select Network. Sort the processes with network activity by Total, Send or Receive, then select the process and inspect associated destinations. B/sec values are byte rates; do not compare them directly with a link’s Mbps.
Record process name, PID, observation time and destination. This PowerShell example links a sample PID to its current TCP connections; replace 4321. It does not measure each process’s bandwidth and is not a complete inventory of UDP traffic:
$trafficProcessId = 4321
Get-Process -Id $trafficProcessId
Get-NetTCPConnection -OwningProcess $trafficProcessId |
    Select-Object LocalAddress, LocalPort, RemoteAddress, RemotePort, State
Resource Monitor describes this host, not the organization’s total internet usage; local LAN traffic may appear too. TCPView complements it with endpoint and owning-process information. Identify the service and its work before closing anything. Names such as System or svchost alone do not establish malware or justify termination.
Microsoft / Resource Monitor · Microsoft / TCPView · Get-NetTCPConnection
6. Separate loops and broadcasts from downloads
If the LAN is badly affected but WAN usage does not match the symptoms, investigate layer-2 behavior. Compare ingress packet, broadcast and multicast rates on affected ports with the topology. Internal traffic may never reach the internet firewall.
Topology-change logs and MAC movement are clues, not proof of where a loop began. We recommend following unexpectedly high input rates and reviewing recent physical connections. Do not blindly disconnect an unfamiliar uplink; constrain only a verified segment with a rollback plan.
7. Correlate usage with backups and updates
Compare the start of the traffic with backups, replication, cloud sync, software distribution and Windows Update. An authorized transfer can still harm the primary service if its timing or bandwidth allocation is unsuitable.
For Delivery Optimization, use Windows’ own reports and diagnostic tools; a shared service name alone does not establish the exact activity. Our proposed response is to confirm the job with its owner and test a narrow schedule or rate adjustment, rather than permanently disabling backups or security updates.
Microsoft / Delivery Optimization
8. Connect application logs to network evidence
If a web service or API is a leading consumer, compare request times, paths, statuses and response sizes in access or application logs. In NGINX, variables such as $body_bytes_sent concern response-body volume; request counts alone do not explain byte consumption.
We recommend collecting only the necessary metadata and looking for repeated downloads, persistent retries or unexpectedly large responses. Application-layer sizes are not interchangeable with on-link volume without considering compression and measurement location. Before calling the incident an attack, correlate service-owner evidence and actual request patterns with the flow data.
NGINX / Access logs · NGINX / Variables
A hypothetical incident: calls fail while downloads work
Suppose the service connection is 100 Mbps, outbound traffic approaches 90 Mbps and calls deteriorate while downloads remain acceptable. First examine outbound capacity and direction; a faster negotiated port does not remove the service limit.
In this teaching scenario, flow data ranks the example host 192.0.2.25 highly. FortiView confirms the matching traffic in the same window. On the endpoint, the backup process and job log align with the incident. With the owner’s agreement, we temporarily lower that transfer’s rate and retest calls and the outbound chart. Improvement is useful evidence; repeatability and other simultaneous activities still need examination before drawing a reliable conclusion.
A practical incident workflow
- Record time and timezone, the affected area and a measure of user impact.
- Identify the busy interface and direction using rates, baseline and errors.
- Follow the same window through flow and firewall records, then identify the device owner.
- If needed, collect endpoint evidence or a scoped capture and make a reversible change.
- Validate the real user operation and chart recovery, then assign prevention and ownership for the cause.
Conclusion: the biggest consumer is not automatically at fault
Our recommendation is to build an evidence chain instead of chasing the largest number: interface, device, destination, process and actual activity. That chain distinguishes legitimate but badly timed work from unexpected transfers, network faults or suspicious behavior.
Related reading
Healthy servers, waiting users: why average latency is not enough
Continue reading
All posts →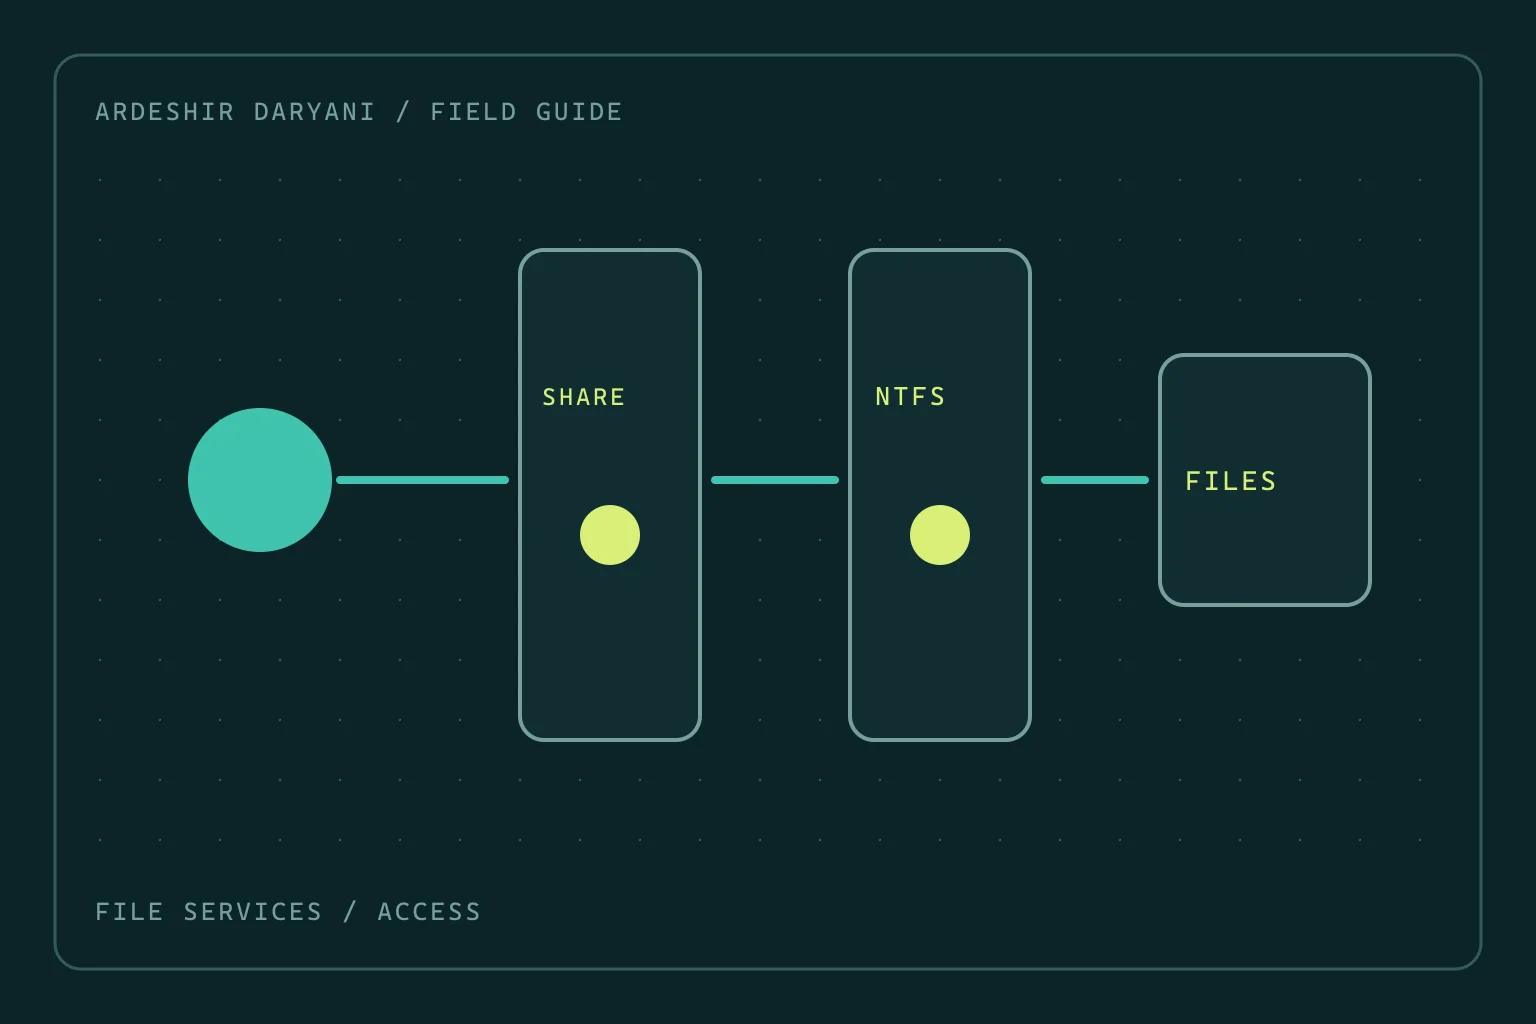
SMB access denied: do not grant Everyone full control
Restore SMB access after permission changes by distinguishing share and NTFS rights, making a narrow correction and testing as the actual user.
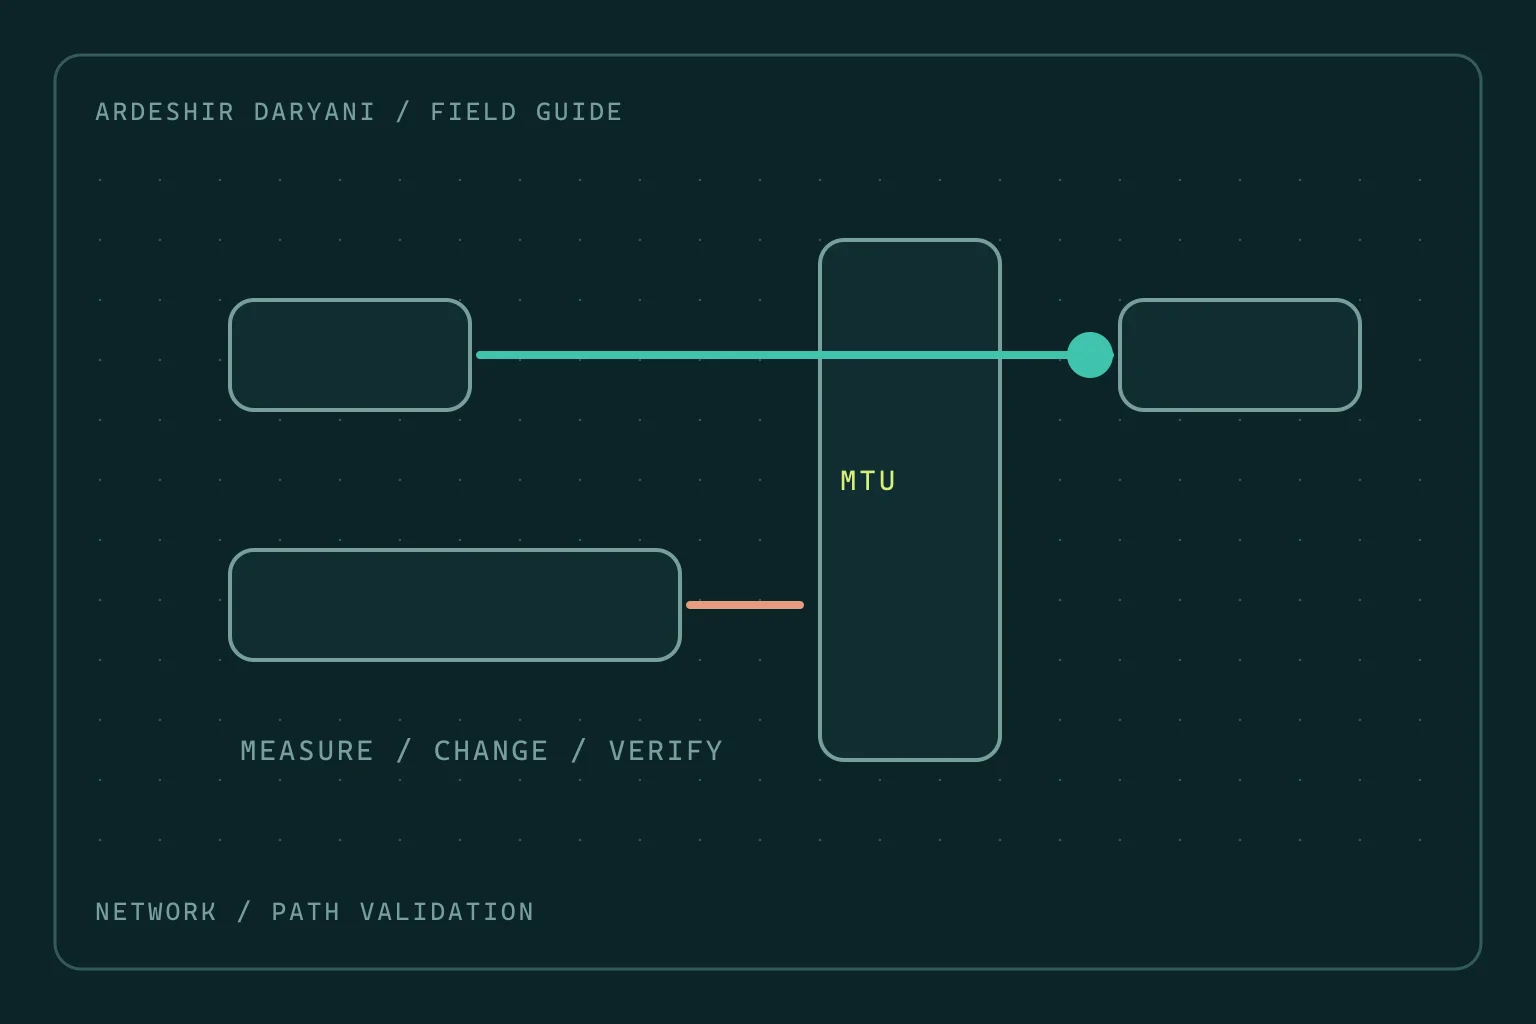
VPN connects but large transfers stall: investigate MTU
When small requests work but large transfers stall, test the MTU hypothesis with evidence rather than changing the entire network at random.
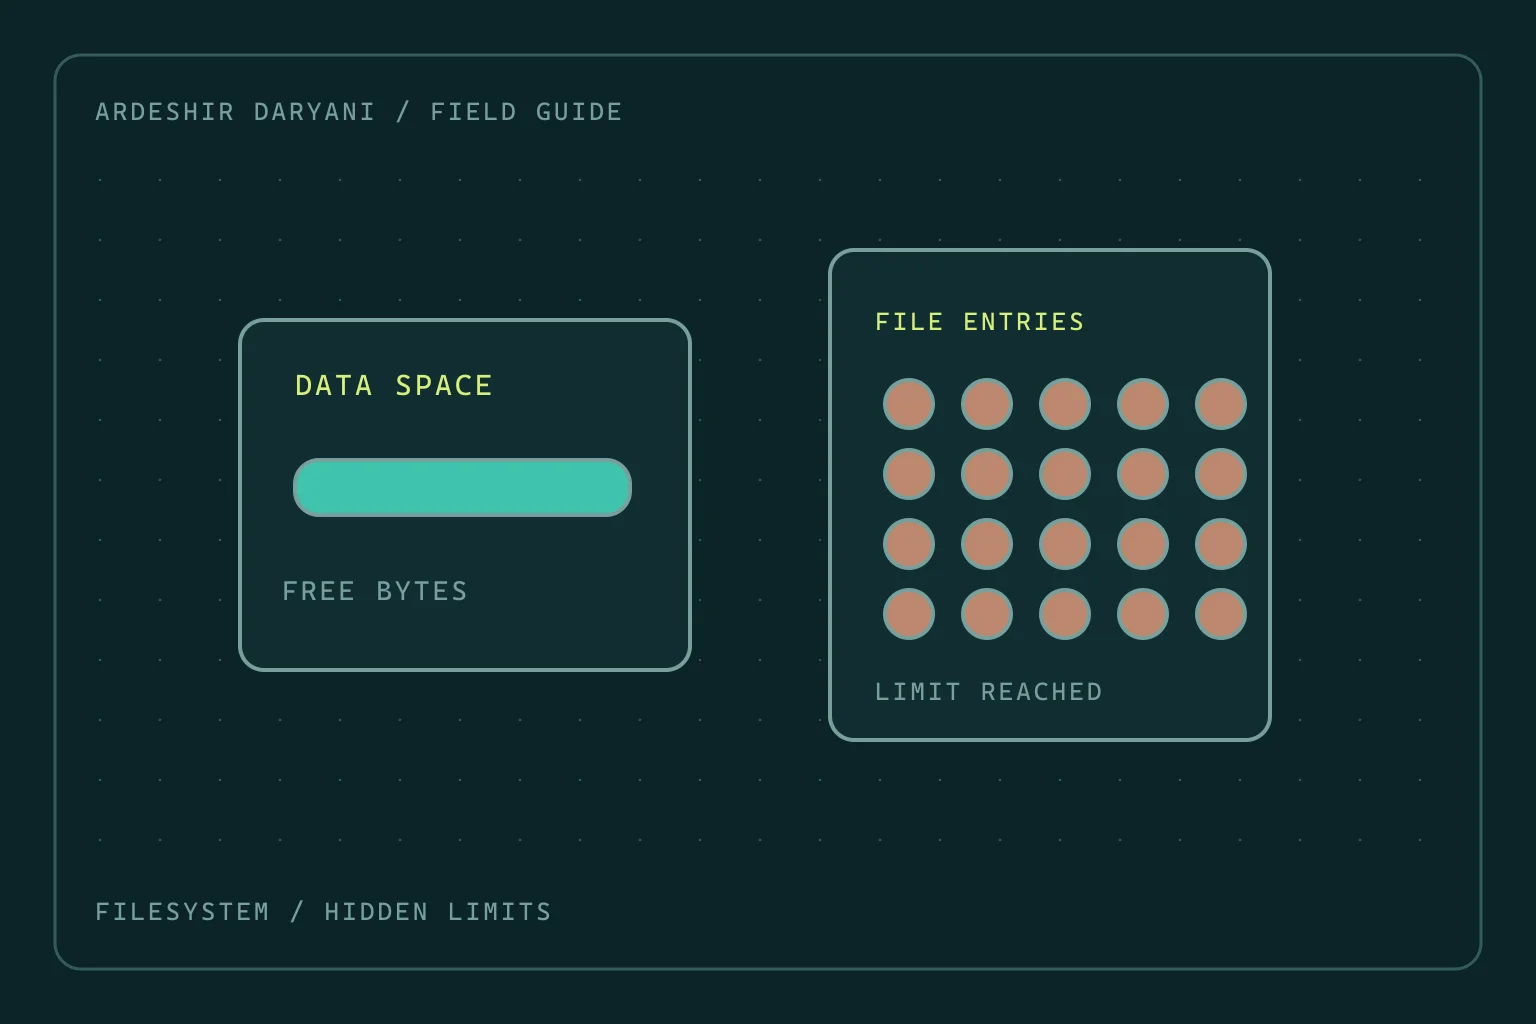
Disk space remains, yet Linux reports no space left
Diagnose inode exhaustion and deleted-but-open files on Linux without indiscriminate cleanup or restarting every service.