The server is up. Does the service actually work?
Go beyond ping with a real user scenario, an essential dependency check and an actionable alert. Define what a healthy service means.
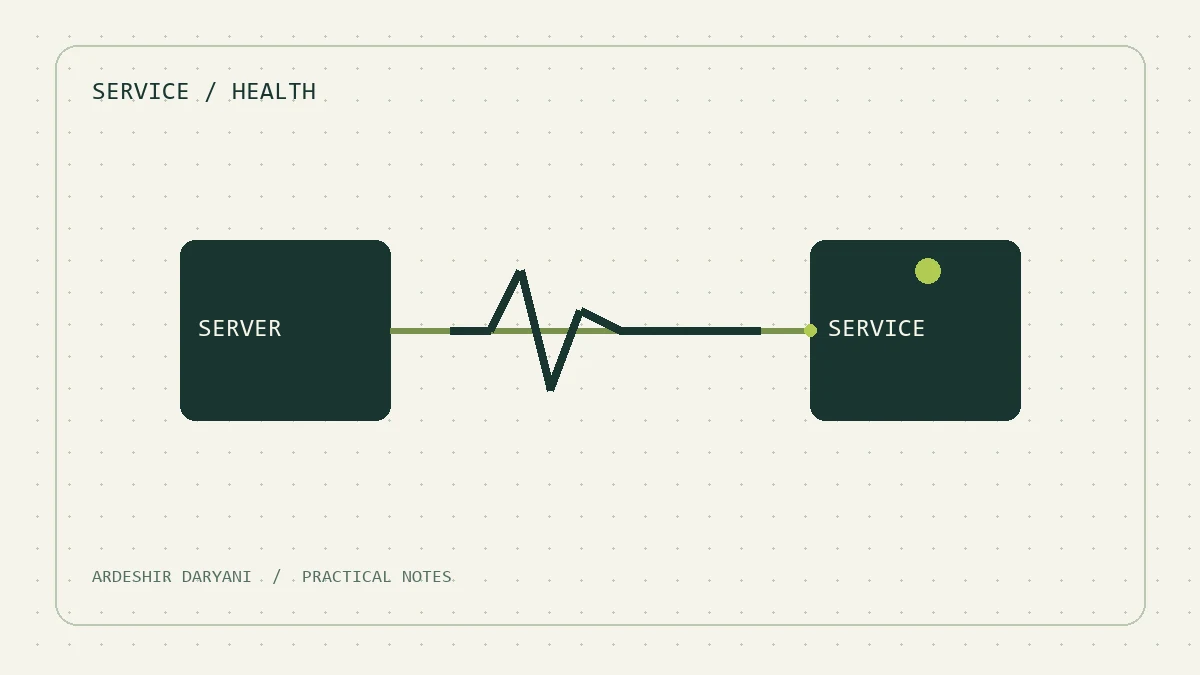
Source of concept: Monitoring Distributed Systems Google SRE. The monitoring plan and example below is an independent offer for a small environment.
The server may respond to ping, but the user cannot open a report. It is not contradiction; we have measured two different things. In my opinion, the monitoring should give at least one clear answer to the question: “The main user job is still done?”
We define health to the layer.
| review. | What shows? |
|---|---|
| Network response. | Part of access to the host. |
| port connection. | It is possible to connect to the listener. |
| Simple answer to the program. | Living the path examined. |
| Taking a real job. | The success of the same particular user scenario. |
No one alone guarantees the health of the whole system. Even a successful HTTP response may be just a good error page of the program; define the content you expect and response time.
Start with a small scenario.
In a hypothetical example, we monitor the reporting system. We choose a test account with minimal access, a small report with non-sensitive data and a recognizable result. The test should be low cost, do not disclose confidential information in the log and do not make a new operational record.
If the program is separate, measure its essential dependencies. However, depending on the process’s live review to all external services may create useless re-launching when a dependencies fail. The decision “is ready to accept the request?” is not the same with the decision of “the process must be implemented again?”
Warnings must have a destination and action.
- What has failed for the user?
- When and where are they seen?
- Who is responsible for the answer and what is the first proposed review?
My suggestion is to first make a useful warning and then increase the number of charts. A dashboard that all the lights are green, but the user is dissatisfied will probably monitor the wrong question.
Related study: Documentary service..
Continue reading
All posts →
The runbook you need at three in the morning
A one-page service runbook template: purpose, dependencies, logs, health checks, recovery and escalation, without storing passwords in the document.
Five things to record before restarting a server
A concise restart checklist covering affected users, dependencies, active work, recovery access and a meaningful post-restart test.
A few minutes of clock drift: how much trouble can it cause?
Check Windows domain time sources and synchronization before changing settings. Distinguish clock drift from a time-zone display issue.